The Detection & SIEM Lab: Catching the Attack with Wazuh
The defensive mirror of the pentest lab: a Wazuh SIEM on the Ubuntu Server box, with agent logs from Kali and the target, Suricata network detection, and VirusTotal file-integrity monitoring. Run the pentest attacks against your own detection and watch one rule auto-delete a malicious file.
- Platform
- Self-hosted
- Target
- Wazuh SIEM stack
- Difficulty
- Medium
- OS
- Linux
- Wazuh
- Suricata
- VirusTotal
- Emerging Threats rules
- nmap
- Hydra
- jq
- siem
- intrusion-detection
- file-integrity-monitoring
- threat-intel
- incident-response
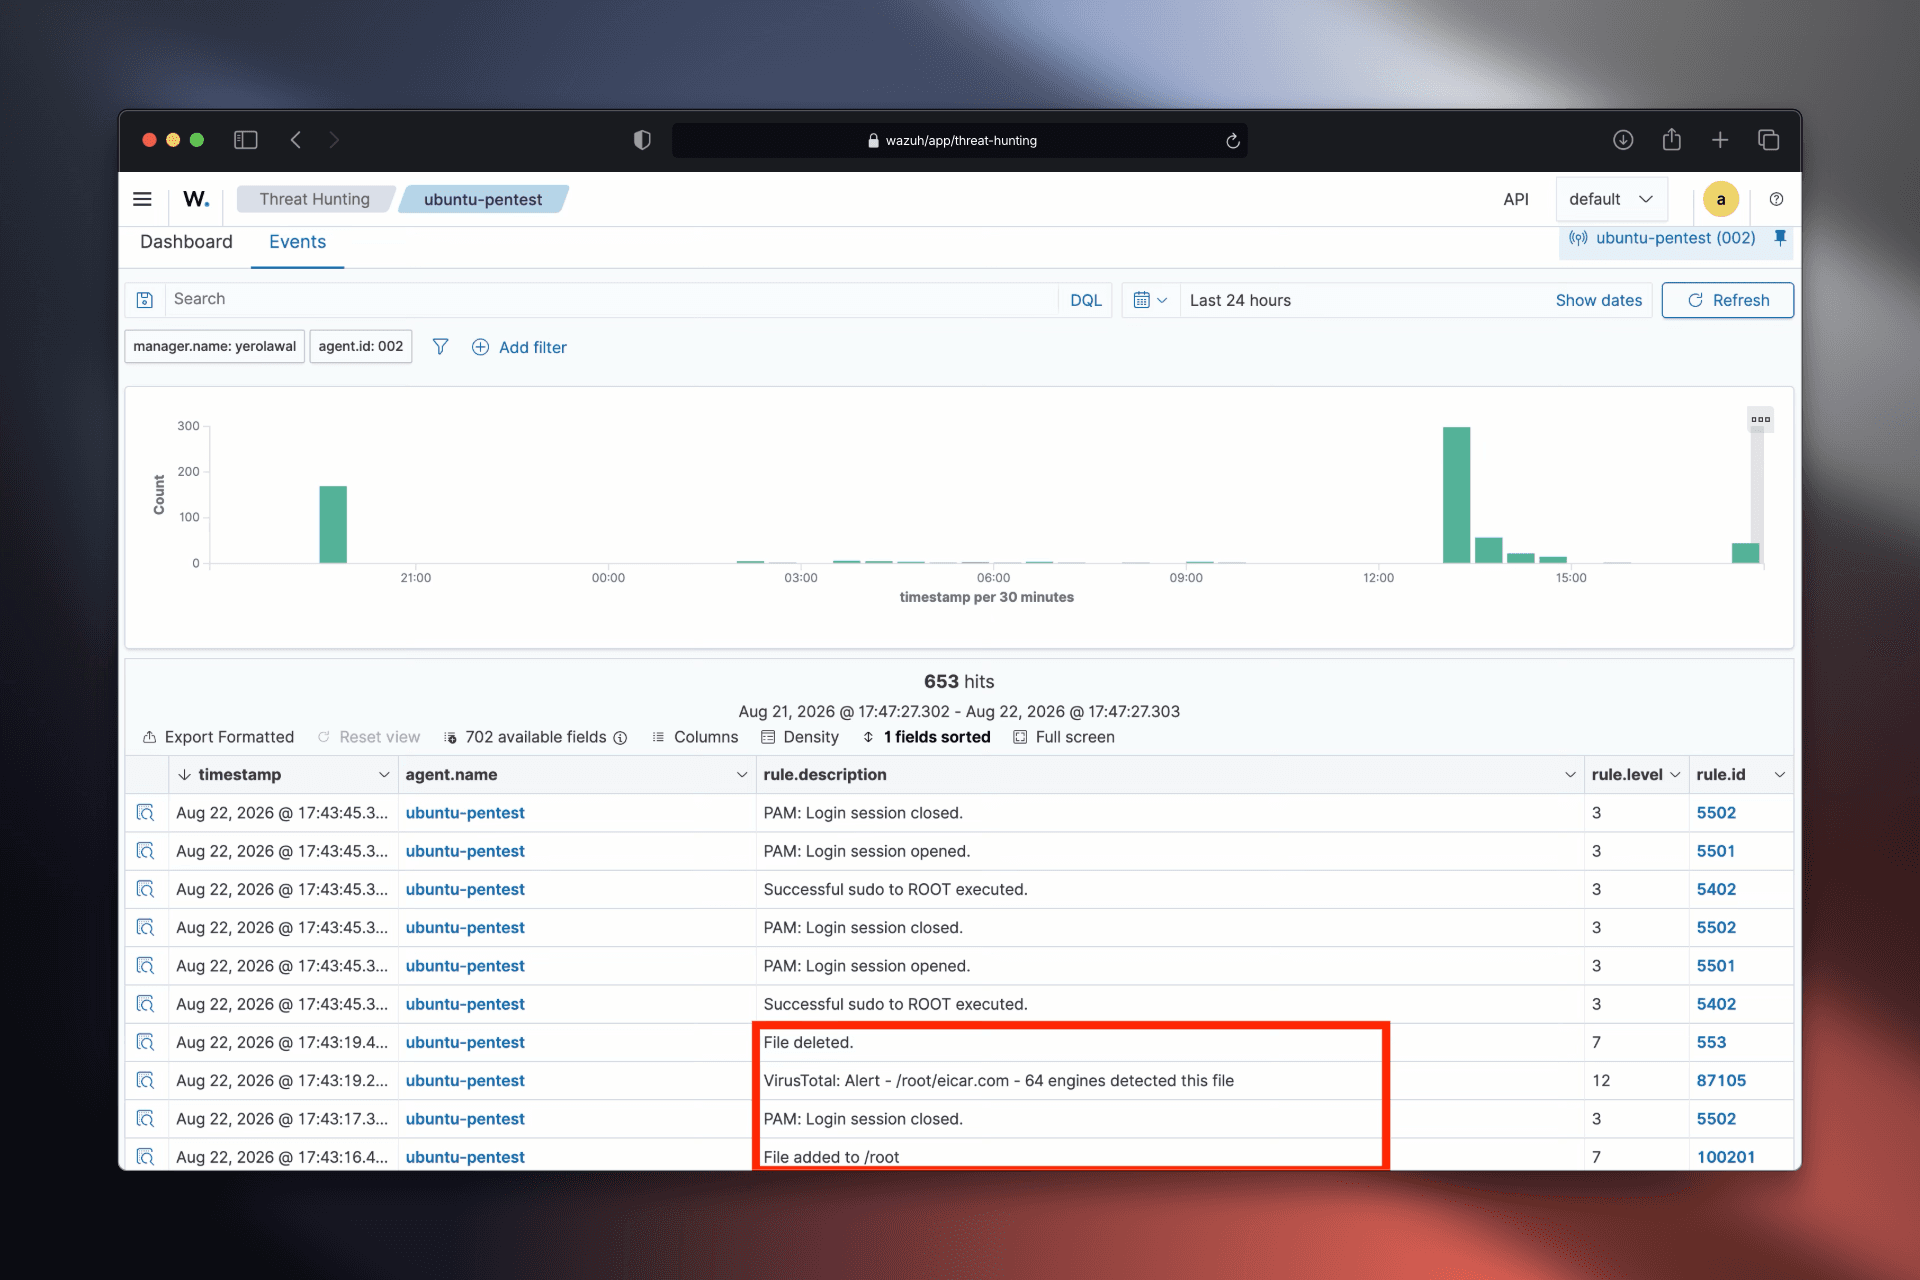
The pentest lab showed what an attacker does. This one builds the half that catches them. You stand up a Wazuh SIEM on the Ubuntu Server box from the foundation, ship logs from Kali and the target into it, add network intrusion detection with Suricata and file-integrity monitoring enriched with VirusTotal, and then run the same attacks from the pentest track against your own detection. By the end, a scan, a brute-force, and a dropped malware sample each raise an alert you can read, and one of them cleans itself up.
This is the defensive mirror. Every offensive move in the pentest lab has a detection here, and the point of the whole exercise is to see the attack and the alert side by side.
Module 0: Foundation setup (expand if this is your first lab)
This lab runs on the shared environment from the Foundation lab. You need three VMs on the Shared Network:
- Ubuntu Server (ARM64, Virtualize,
192.168.64.3): this becomes the Wazuh host. - Kali (ARM64, Virtualize,
192.168.64.2): the first agent, and the attacker later. - One x86 target (Emulate, e.g. Metasploitable 2 at
192.168.64.4): the second agent and the victim.
If you have not built those yet, the full walkthrough with every gotcha is in the Foundation lab. Snapshot the target while it is clean before you start.
What you are building#
Wazuh is a single platform wearing three hats: a manager that collects and analyses events, an indexer that stores them, and a dashboard that shows them. Agents on each endpoint ship host logs to the manager. On top of that, Suricata reads the wire and reports network events, and file-integrity monitoring watches sensitive directories and checks any new file against VirusTotal. Everything lands in one dashboard.
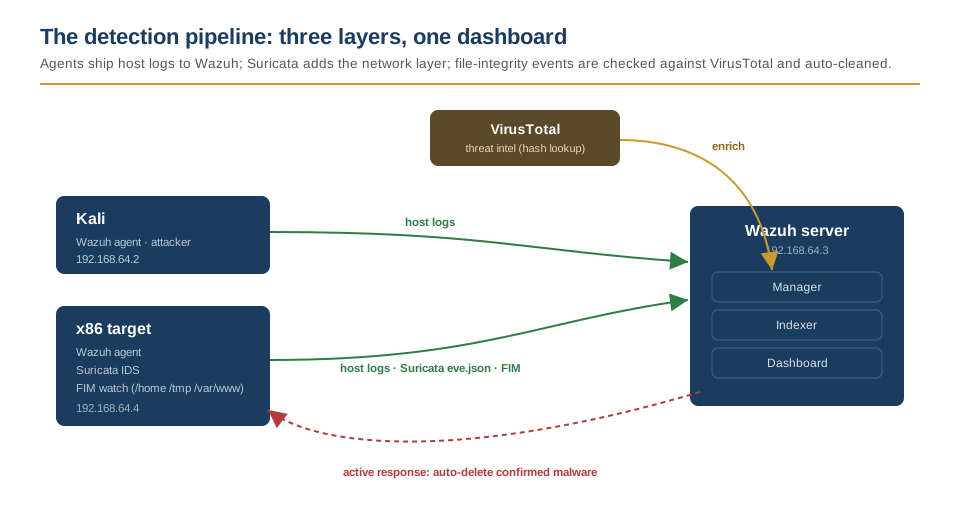
The three detection layers you will end up with, and the attack each one catches:
| Layer | Watches | Catches |
|---|---|---|
| Network (Suricata) | Traffic on the target's interface | Port and version scans |
| Host (Wazuh agent) | Auth and system logs | SSH brute-force, logins |
| FIM + VirusTotal | Sensitive directories | Malware written to disk |
1. Install Wazuh#
Wazuh ships an assisted installer that stands up the manager, indexer, and dashboard on one node. Run it on the Ubuntu Server VM.
SSH in from your Mac, then download and run the installer:
sudo apt update
curl -sO https://packages.wazuh.com/4.14/wazuh-install.sh
sudo bash ./wazuh-install.sh -a
The -a flag is the all-in-one install. It prints the admin password at the end; copy it, because it is shown once. The install takes a few minutes and is memory-hungry, which is why the foundation gives this box 6 GB.
Open the dashboard from your Mac browser at https://192.168.64.3 (accept the self-signed certificate warning). Log in as admin with the password the installer printed.
Checkpoint: the dashboard loads and shows zero agents. That is expected; you add them next.
If the dashboard is unreachable or read-only later: the indexer locks itself read-only when its disk fills. Free space, then restart the three services in order (
wazuh-indexer,wazuh-manager,wazuh-dashboard). This is the single most common way the stack gets stuck.
2. Deploy the agents#
An agent is architecture-specific, so match the package to the host: Kali is ARM64, the x86 target is amd64.
| Endpoint | Package |
|---|---|
Kali (192.168.64.2) | wazuh-agent aarch64 .deb |
x86 target (192.168.64.4) | wazuh-agent amd64 .deb |
On the dashboard, open Agents → Deploy new agent, pick the OS and architecture, and set the manager address to 192.168.64.3. The dashboard generates the exact install command, including the enrolment key. Run it on the endpoint, then enable and start the service:
# Example shape; use the command the dashboard generates for each host
wget https://packages.wazuh.com/4.x/apt/pool/main/w/wazuh-agent/wazuh-agent_4.14.x-1_ARCH.deb
sudo WAZUH_MANAGER="192.168.64.3" dpkg -i ./wazuh-agent_4.14.x-1_ARCH.deb

sudo systemctl daemon-reload
sudo systemctl enable wazuh-agent
sudo systemctl start wazuh-agent
Verify on the dashboard: both agents show Active.
Kali logs to journald, not
/var/log/auth.log. The agent already reads journald by default, so do not add a duplicate localfile block for auth on Kali, or you will double-count events.
Checkpoint: Agents page shows Kali and the target as Active, with a recent keep-alive.
3. Suricata IDS#
Suricata gives you the network layer. Install it on the x86 target so it sees traffic on the lab network, then feed its events into that host's Wazuh agent.
Install from the stable PPA:
sudo add-apt-repository ppa:oisf/suricata-stable
sudo apt-get update
sudo apt-get install suricata -y
suricata -V
Download the Emerging Threats open ruleset:
cd /tmp/
curl -LO https://rules.emergingthreats.net/open/suricata-6.0.8/emerging.rules.tar.gz
sudo tar -xvzf emerging.rules.tar.gz
sudo mkdir -p /etc/suricata/rules
sudo mv rules/*.rules /etc/suricata/rules/
Edit /etc/suricata/suricata.yaml so it knows your network and where the rules live:
HOME_NET: "[192.168.64.0/24]"
EXTERNAL_NET: "any"

default-rule-path: /etc/suricata/rules
rule-files:
  - "*.rules"

af-packet:
  - interface: enp0s1   # your lab interface; check with `ip addr`
Duplicate
HOME_NET/EXTERNAL_NETkeys fail silently. The stock file already defines them once. Edit the existing lines rather than adding new ones; a duplicate key does not error, it just quietly misconfigures the engine.
Test the config, then start it:
sudo suricata -T -c /etc/suricata/suricata.yaml   # -T = test only
sudo systemctl restart suricata
sudo systemctl status suricata
Point the agent at Suricata's event log by adding a localfile block to the target's /var/ossec/etc/ossec.conf, inside <ossec_config>:
<localfile>
  <log_format>json</log_format>
  <location>/var/log/suricata/eve.json</location>
</localfile>
Restart the agent so it picks up the new log:
sudo systemctl restart wazuh-agentCheckpoint: sudo tail /var/log/suricata/eve.json shows JSON events, and the Wazuh dashboard starts showing Suricata-sourced alerts under the target agent.
4. VirusTotal file-integrity monitoring#
This is the layer the pentest lab does not have an equivalent for, and it is the most satisfying one: the SIEM watches sensitive directories, and when a new file appears it checks the file's hash against VirusTotal and, if enough engines flag it, deletes it automatically.
Register for a free API key at virustotal.com and copy your key from your profile. The free tier is rate-limited, which is fine for a lab.
On the target agent, watch the directories an attacker writes to. Edit /var/ossec/etc/ossec.conf:
<syscheck>
  <disabled>no</disabled>
  <frequency>300</frequency>
  <directories check_all="yes" realtime="yes">/home,/root</directories>
  <directories check_all="yes" realtime="yes">/tmp</directories>
  <directories check_all="yes" realtime="yes">/var/www</directories>
</syscheck>
On the manager, wire the VirusTotal integration into /var/ossec/etc/ossec.conf:
<integration>
  <name>virustotal</name>
  <api_key>YOUR_VT_API_KEY</api_key>
  <group>syscheck</group>
  <alert_format>json</alert_format>
</integration>
Add two custom rules to /var/ossec/etc/rules/local_rules.xml. These build on Wazuh's base VirusTotal alert (rule 87105): the first fires when any engine flags a file, the second escalates when ten or more do and triggers the cleanup.
<group name="virustotal,">

  <!-- Any engine flags the file -->
  <rule id="100200" level="12">
    <if_sid>87105</if_sid>
    <field name="virustotal.positives" type="pcre2">\d+</field>
    <description>VirusTotal: $(virustotal.source.file) flagged by $(virustotal.positives) engine(s)</description>
  </rule>

  <!-- Ten or more engines: confirmed malicious, trigger removal -->
  <rule id="100201" level="15">
    <if_sid>100200</if_sid>
    <field name="virustotal.positives" type="pcre2">^([1-9]\d|[1-9]\d{2,})$</field>
    <description>VirusTotal: CONFIRMED MALICIOUS, $(virustotal.positives) engines flagged $(virustotal.source.file)</description>
  </rule>

</group>
Wire the active response that deletes the file, also in the manager's ossec.conf:
<command>
  <name>remove-threat</name>
  <executable>remove-threat.sh</executable>
  <timeout_allowed>no</timeout_allowed>
</command>

<active-response>
  <disabled>no</disabled>
  <command>remove-threat</command>
  <location>local</location>
  <rules_id>100201</rules_id>
</active-response>
Create the removal script at /var/ossec/active-response/bin/remove-threat.sh. It reads the alert from stdin, pulls the flagged file path with jq, deletes it, and logs what it did:
#!/bin/bash
LOG_FILE="/var/ossec/logs/active-responses.log"
read INPUT_JSON
FILENAME=$(echo "$INPUT_JSON" | jq -r .parameters.alert.data.virustotal.source.file)
COMMAND=$(echo "$INPUT_JSON" | jq -r .command)

if [ "$COMMAND" = "add" ]; then
  if [ -f "$FILENAME" ]; then
    rm -f "$FILENAME"
    echo "$(date) remove-threat: deleted $FILENAME" >> "$LOG_FILE"
  else
    echo "$(date) remove-threat: file not found $FILENAME" >> "$LOG_FILE"
  fi
fi
Install jq, set ownership and permissions, and restart the manager:
sudo apt-get install jq -y
sudo chown root:wazuh /var/ossec/active-response/bin/remove-threat.sh
sudo chmod 750 /var/ossec/active-response/bin/remove-threat.sh
sudo systemctl restart wazuh-manager
Test it with EICAR, the standard harmless antivirus test string that every engine flags. On the target:
echo 'X5O!P%@AP[4\PZX54(P^)7CC)7}$EICAR-STANDARD-ANTIVIRUS-TEST-FILE!$H+H*' > /root/eicar.txtWatch the chain fire on the dashboard: FIM detects the new file, the manager sends the hash to VirusTotal, rule 100200 then 100201 fire, and the active response deletes /root/eicar.txt. Confirm the deletion and the log:
cat /var/ossec/logs/active-responses.log
ls -la /root/eicar.txt   # should be gone
Checkpoint: active-responses.log shows a deleted /root/eicar.txt line, and the file is gone.
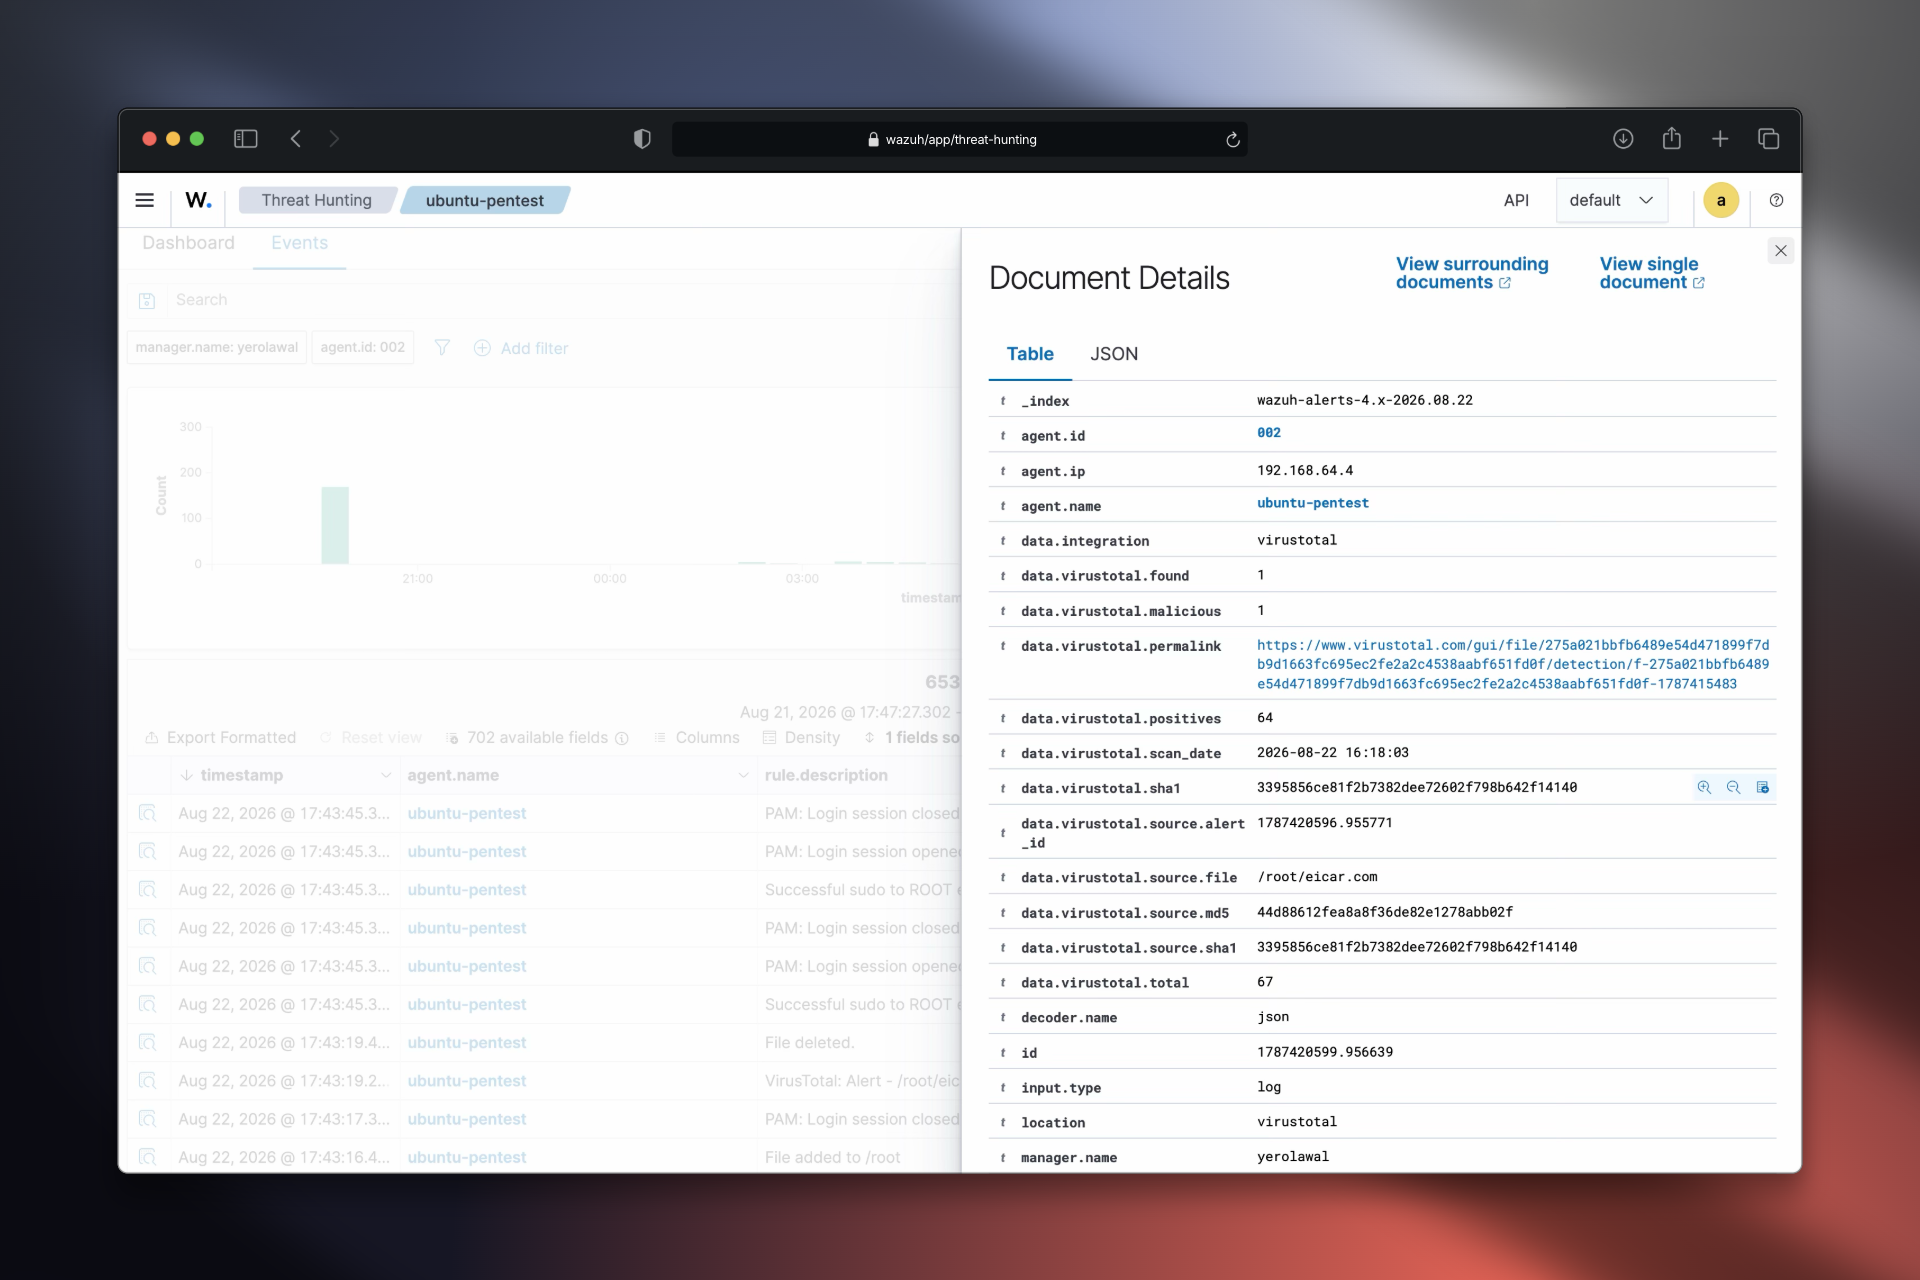
The reason this counts as evidence rather than a screenshot of a dashboard is the alert document itself. Expand the VirusTotal alert and you get the fields the verdict was built on: the file path, its MD5 and SHA1, how many engines flagged it, and a permalink back to the VirusTotal report.
5. Attack and detect#
Now run the pentest track's attacks against your own detection. This is the capstone: the same commands, now generating alerts instead of just access.
Network layer: scan from Kali. From the pentest lab you already know this scan. Run it at the target:
# From Kali
nmap -sV 192.168.64.4
On the dashboard, the target agent shows Suricata ET SCAN alerts (Nmap service scan, version probes). The network layer caught the recon.
Host layer: SSH brute-force from Kali. Point Hydra at SSH the way the pentest lab does. On the dashboard, the host layer raises authentication-failure alerts, and a burst of them is the brute-force signature. Two independent layers now describe the same attack: Suricata saw the packets, the agent saw the failed logins.
FIM + VirusTotal: drop a suspicious file. Copy the EICAR file from Kali to the target to simulate malware landing on the box after a compromise:
# From Kali
scp /tmp/eicar.txt user@192.168.64.4:/tmp/
FIM catches the write, VirusTotal confirms it, and the active response removes it, all without you touching the dashboard. That is the full detect-and-respond loop.
Checkpoint: the dashboard's Threat Hunting and MITRE ATT&CK views show the scan, the brute-force, and the file event, each mapped to a technique.
Skip the VirusTotal parts if you did not set up section 4. The scan and brute-force detection still work on their own; the FIM auto-delete is the only piece that needs the integration.
6. Daily operations#
- Start order: bring up the Wazuh server first, give it a minute, then the endpoints, then open the dashboard. The agents reconnect on their own.
- Snapshot after every milestone. The same
qemu-img snapshotdiscipline from the foundation applies here: snapshot the Wazuh server once it is installed and configured, before you start breaking things, so a bad config change is a rollback rather than a reinstall. - Watch the indexer's disk. Log data grows; when the disk fills, the indexer goes read-only and the dashboard stops updating. Free space and restart the three services.
Appendix: troubleshooting#
| Symptom | Cause | Fix |
|---|---|---|
| Dashboard unreachable after it worked | Indexer went read-only on a full disk | Free space, restart wazuh-indexer, wazuh-manager, wazuh-dashboard |
| Agent stuck "Never connected" | Wrong manager IP, or the agent cannot reach 192.168.64.3 | Check WAZUH_MANAGER, confirm both VMs are on Shared Network |
| Suricata will not start | Duplicate HOME_NET/EXTERNAL_NET, or a rule-path typo | suricata -T -c ... to test; delete duplicate keys |
| No Suricata alerts in Wazuh | Agent not reading eve.json | Confirm the localfile block and restart the agent |
| VirusTotal rules never fire | API key wrong, rate-limited, or syscheck not watching the path | Check the manager logs; confirm the file landed in a watched directory |
| EICAR file not deleted | Script not executable, wrong owner, or jq missing | chmod 750, chown root:wazuh, install jq, restart the manager |
Where this sits#
This lab is the blue-team counterpart to the pentest lab: the attacks you ran there are the events you detect here. It also sets up the two tracks that build on a working SIEM:
- Phishing bridge (planned): run a phishing campaign and write the custom Wazuh rules that detect it, a purple-team exercise that reuses this exact stack.
- AI-augmented SOC (planned): layer network inventory, Grafana dashboards, and AI-assisted alert triage on top of the detection you built here.
See how the tracks connect on the interactive labs map.